Lethal Company v72 (Build ID: 18916695)時点のQuotaの計算に関する仕様の解析メモです。
Quotaの増加量のランダム性
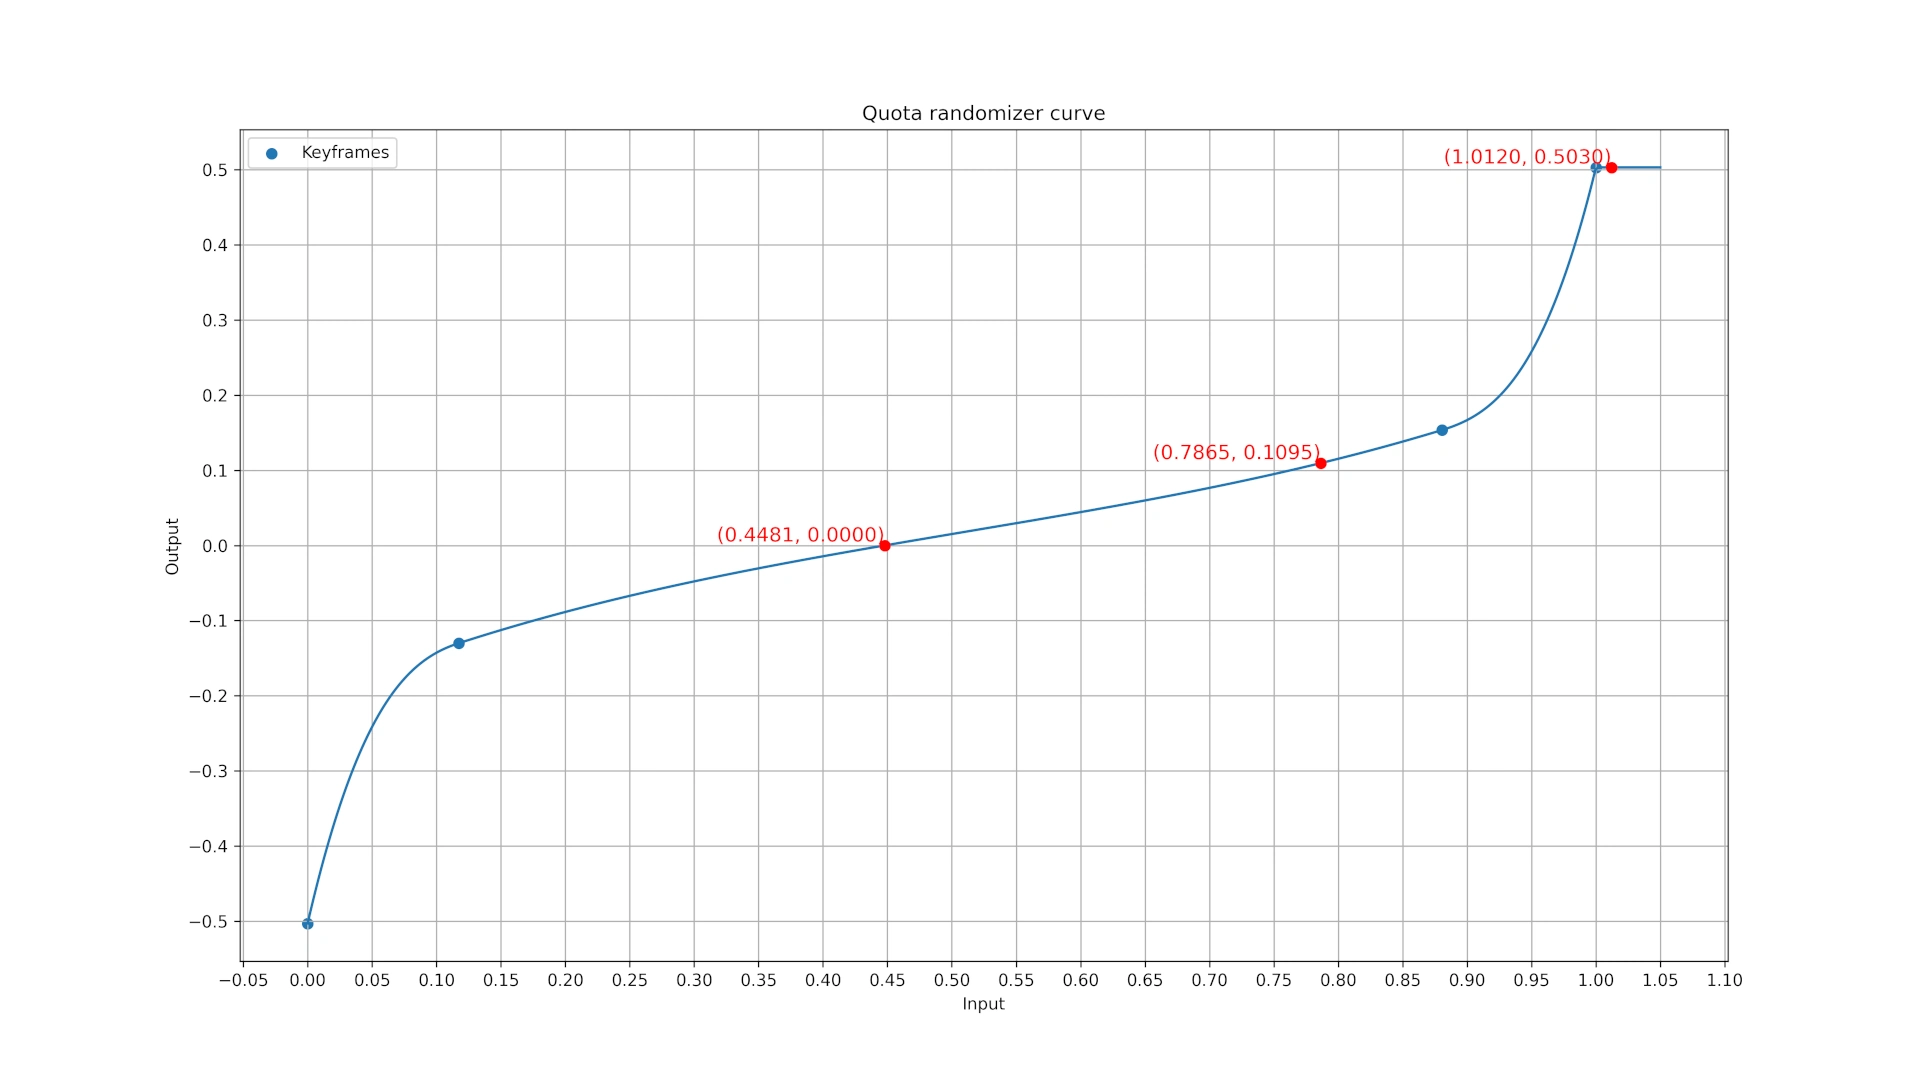
Quotaの増加量のランダム性は、TimeOfDay.quotaVariables.randomizerCurveで定義される、右肩上がりのランダマイザ曲線によってもたらされます。
このランダマイザ曲線は、以下の制御点を持つエルミート曲線です。
x |
y |
in_tangent |
out_tangent |
|---|---|---|---|
| 0 | -0.5030289 | 7.455404 | 7.455404 |
| 0.117235 | -0.1301773 | 0.5548811 | 0.5548811 |
| 0.8803625 | 0.1534421 | 0.5221589 | 0.5221589 |
| 1 | 0.5030365 | 7.051469 | 7.051469 |
Unity 2022.3.9f1のAnimationCurveが使われています。
preWrapModeおよびpostWrapModeは、ClampForeverに設定されています。
これにより、[0, 1]の外側の評価値は、端点の値になります。
ランダマイザ曲線の描画スクリプト(Python)
Details
from dataclasses import dataclass
from typing import List
import bisect
import numpy as np
import matplotlib.pyplot as plt
from matplotlib.ticker import MultipleLocator


# ---- Unity AnimationCurve Keyframes ----
# pre_wrap, post_wrap: ClampForever
KEYFRAMES_RAW = [
    {"time": 0.0,       "value": -0.5030289, "inTangent": 7.455404,  "outTangent": 7.455404},
    {"time": 0.117235,  "value": -0.1301773, "inTangent": 0.5548811, "outTangent": 0.5548811},
    {"time": 0.8803625, "value": 0.1534421,  "inTangent": 0.5221589, "outTangent": 0.5221589},
    {"time": 1.0,       "value": 0.5030365,  "inTangent": 7.051469,  "outTangent": 7.051469},
]

@dataclass
class Key:
    time: float
    value: float
    inTangent: float
    outTangent: float


# ---- Unity-style Hermite evaluator (non-weighted) ----
class Curve:
    def __init__(self, keys: List[Key]):
        self.keys = sorted(keys, key=lambda k: k.time)

    def evaluate(self, t: float) -> float:
        if not self.keys:
            return 0.0
        if len(self.keys) == 1:
            return self.keys[0].value

        times = [k.time for k in self.keys]
        # ClampForever: 範囲外は端の値を返す
        if t <= self.keys[0].time:
            return self.keys[0].value
        if t >= self.keys[-1].time:
            return self.keys[-1].value

        i = bisect.bisect_right(times, t) - 1
        k0 = self.keys[i]
        k1 = self.keys[i + 1]

        t0, t1 = k0.time, k1.time
        y0, y1 = k0.value, k1.value
        dx = t1 - t0
        if dx == 0.0:
            return y1

        u = (t - t0) / dx
        m0 = k0.outTangent
        m1 = k1.inTangent

        h00 =  2*u**3 - 3*u**2 + 1
        h10 =    u**3 - 2*u**2 + u
        h01 = -2*u**3 + 3*u**2
        h11 =    u**3 -   u**2

        return h00*y0 + h10*(dx*m0) + h01*y1 + h11*(dx*m1)


def main():
    # Build curve
    curve = Curve([Key(**k) for k in KEYFRAMES_RAW])

    # Sample and plot
    # 右に5%の外挿を含めてサンプリング
    t_min = KEYFRAMES_RAW[0]["time"]
    t_max = KEYFRAMES_RAW[-1]["time"]
    t_range = t_max - t_min
    ts = np.linspace(t_min, t_max + t_range * 0.05, 500)
    ys = np.array([curve.evaluate(t) for t in ts])

    plt.figure(
        figsize=(16, 9),
        dpi=300,
        facecolor='white',
        edgecolor='black'
    )
    plt.plot(ts, ys)
    plt.scatter([k["time"] for k in KEYFRAMES_RAW],
                [k["value"] for k in KEYFRAMES_RAW],
                label="Keyframes")
    plt.xlabel("Input")
    plt.ylabel("Output")
    plt.legend()
    plt.title("Quota randomizer curve")
    plt.grid(True, which='both', axis='both')
    plt.gca().xaxis.set_major_locator(MultipleLocator(0.05))
    plt.gca().yaxis.set_major_locator(MultipleLocator(0.1))

    ts_expect = np.linspace(t_min, t_max, 1000)
    ys_expect = np.array([curve.evaluate(t) for t in ts_expect])
    expected_value = ys_expect.mean()
    print(f"期待値: {expected_value:.4f}")

    # 特別なX値でのY値を取得し、グラフに表示
    special_xs = [0.7865, 1.012]
    for x in special_xs:
        y = curve.evaluate(x)
        plt.plot(x, y, 'ro')  # 赤丸でマーク
        plt.text(x, y, f"({x:.4f}, {y:.4f})", color='red', fontsize=12, ha='right', va='bottom')

        # 制限値付きの期待値の計算
        ts_expect = np.linspace(t_min, x, 1000)
        ys_expect = np.array([curve.evaluate(t) for t in ts_expect])
        expected_value = ys_expect.mean()
        print(f"制限付き期待値(x <= {x}): {expected_value:.4f}")

    # Y=0となるtを探索し、同様にプロット
    zero_crossings: list[float] = []
    for i in range(len(ts)-1):
        if ys[i] * ys[i+1] < 0:
            # 線形補間でゼロ点近似
            t0, t1 = ts[i], ts[i+1]
            y0, y1 = ys[i], ys[i+1]
            t_zero = t0 - y0 * (t1 - t0) / (y1 - y0)
            zero_crossings.append(t_zero)

    for x in zero_crossings:
        y = 0.0
        plt.plot(x, y, 'ro')
        plt.text(x, y, f"({x:.4f}, 0.0000)", color='red', fontsize=12, ha='right', va='bottom')

    plt.savefig("quota_randomizer_curve.png")


if __name__ == "__main__":
    main()
LuckとQuotaの関係
Luckが大きいほどQuotaは上がりにくくなり、Luckが小さいほどQuotaは上がりやすくなります。
Luckの合計値はTimeOfDay.CalculateLuckValue()関数で計算されます。
この関数は、Quotaを設定するTimeOfDay.SetNewProfitQuota()関数で使用されています。
初めてQuotaを満たしたときは、Luck = 0が使用されます。 2回目以降にQuotaを満たしたときは、前回Quotaを満たしたときに設置されていた家具によるLuckの合計値が使用されます。
Luckは、ランダマイザ曲線の入力値[0, 1]を[0, abs(luck - 1)]に変化させます。
Luckの値が0の場合、入力値は[0, 1]、出力値は[-0.5030, 0.5030]、期待値は0.0127になります。
Luckの最小値-0.012の場合、入力値は[0, 1.012]、出力値は[-0.5030, 0.5030]、期待値は0.0185になります。
Luckの最大値0.2135の場合、入力値は[0, 0.7865]、出力値は[-0.5030, 0.1095]、期待値は-0.0396になります。
Quotaの計算式
\(t\) 回目のQuotaの増加量 \(\Delta q_t\) は、以下の式で表されます。 \(t\) はQuotaを満たした回数、\(r\) はランダマイザ曲線の出力です。
$$ \Delta q_t = 100 (1 + \frac{t^2}{16}) (1 + r) $$
\(t\) 回目のQuota値 \(q_t\) は、以下の式で表されます。
$$ q_0 = 130 $$
$$ q_t = q_{t-1} + \Delta q_t \quad (t \geq 1, t \in \mathbb{Z}) $$
Luckが初期値の場合のQuota値
Luckが初期値(0)の場合のQuota値は、以下のように計算されます。
| 回数 t | 最小値 (r=-0.5030) | 最大値 (r=0.5030) | 期待値 (r=0.0127) |
|---|---|---|---|
| 0 | 130 | 130 | 130 |
| 1 | 182 | 289 | 237 |
| 2 | 244 | 476 | 363 |
| 3 | 321 | 710 | 521 |
| 4 | 420 | 1010 | 723 |
| 5 | 547 | 1395 | 982 |
| 6 | 708 | 1883 | 1311 |
| 7 | 909 | 2493 | 1722 |
| 8 | 1157 | 3244 | 2228 |
| 9 | 1458 | 4155 | 2841 |
| 10 | 1818 | 5244 | 3575 |
| 11 | 2243 | 6530 | 4442 |
| 12 | 2740 | 8033 | 5454 |
| 13 | 3314 | 9770 | 6624 |
| 14 | 3972 | 11761 | 7965 |
| 15 | 4720 | 14024 | 9490 |
| 16 | 5564 | 16579 | 11211 |
| 17 | 6511 | 19444 | 13141 |
| 18 | 7567 | 22637 | 15292 |
| 19 | 8738 | 26178 | 17678 |
| 20 | 10030 | 30085 | 20311 |
Luckが最小値の場合のQuota値
Luckが最小値(-0.012)の場合のQuota値は、以下のように計算されます。
t = 1 については、Luck = 0 として計算しています。 t >= 2 では、Luck = 最小値(-0.012)として計算しています。
| 回数 t | 最小値 (r=-0.5030) | 最大値 (r=0.5030) | 期待値 (r=0.0185) |
|---|---|---|---|
| 0 | 130 | 130 | 130 |
| 1 | 182 | 289 | 237 |
| 2 | 244 | 476 | 364 |
| 3 | 321 | 710 | 523 |
| 4 | 420 | 1010 | 726 |
| 5 | 547 | 1395 | 986 |
| 6 | 708 | 1883 | 1317 |
| 7 | 909 | 2493 | 1730 |
| 8 | 1157 | 3244 | 2239 |
| 9 | 1458 | 4155 | 2856 |
| 10 | 1818 | 5244 | 3594 |
| 11 | 2243 | 6530 | 4466 |
| 12 | 2740 | 8033 | 5484 |
| 13 | 3314 | 9770 | 6661 |
| 14 | 3972 | 11761 | 8010 |
| 15 | 4720 | 14024 | 9544 |
| 16 | 5564 | 16579 | 11275 |
| 17 | 6511 | 19444 | 13216 |
| 18 | 7567 | 22637 | 15380 |
| 19 | 8738 | 26178 | 17779 |
| 20 | 10030 | 30085 | 20427 |
Luckが最大値の場合のQuota値
Luckが最大値(0.2135)の場合のQuota値は、以下のように計算されます。
t = 1 については、Luck = 0 として計算しています。 t >= 2 では、Luck = 最大値(0.2135)として計算しています。
| 回数 t | 最小値 (r=-0.5030) | 最大値 (r=0.1095) | 期待値 (r=-0.0396) |
|---|---|---|---|
| 0 | 130 | 130 | 130 |
| 1 | 182 | 289 | 237 |
| 2 | 244 | 427 | 357 |
| 3 | 321 | 600 | 507 |
| 4 | 420 | 821 | 699 |
| 5 | 547 | 1105 | 945 |
| 6 | 708 | 1465 | 1257 |
| 7 | 909 | 1915 | 1647 |
| 8 | 1157 | 2469 | 2127 |
| 9 | 1458 | 3141 | 2709 |
| 10 | 1818 | 3945 | 3405 |
| 11 | 2243 | 4895 | 4227 |
| 12 | 2740 | 6004 | 5187 |
| 13 | 3314 | 7286 | 6297 |
| 14 | 3972 | 8756 | 7569 |
| 15 | 4720 | 10427 | 9015 |
| 16 | 5564 | 12313 | 10647 |
| 17 | 6511 | 14427 | 12477 |
| 18 | 7567 | 16784 | 14517 |
| 19 | 8738 | 19398 | 16779 |
| 20 | 10030 | 22282 | 19276 |
Quota値の計算スクリプト(Python)
Details
import math


def main():
    r_min_max_exp_list = [
        # 最小値, 最大値, 期待値
        (-0.5030, 0.5030, 0.0127),  # Luck = 0
        (-0.5030, 0.5030, 0.0185),  # Luck = 最小値 (-0.012)
        (-0.5030, 0.1095, -0.0396),  # Luck = 最大値 (0.2135)
    ]

    count = 20

    for r_min, r_max, r_exp in r_min_max_exp_list:
        print(f"r_min: {r_min:.4f}, r_max: {r_max:.4f}, r_exp: {r_exp:.4f}")

        q_min = [130]
        q_max = [130]
        q_exp = [130]

        # t = 1 のときは、Luck = 0 として計算
        luck_zero_r_min, luck_zero_r_max, luck_zero_r_exp = r_min_max_exp_list[0]

        for t in range(1, count + 1):
            _r_min = r_min if t > 1 else luck_zero_r_min
            _r_max = r_max if t > 1 else luck_zero_r_max
            _r_exp = r_exp if t > 1 else luck_zero_r_exp

            dq_min = 100 * (1 + t**2 / 16) * (1 + _r_min)
            dq_max = 100 * (1 + t**2 / 16) * (1 + _r_max)
            dq_exp = 100 * (1 + t**2 / 16) * (1 + _r_exp)
            q_min.append(q_min[-1] + math.floor(dq_min))
            q_max.append(q_max[-1] + math.floor(dq_max))
            q_exp.append(q_exp[-1] + math.floor(dq_exp))

        print(f"| 回数 t | 最小値 (r={r_min:.4f}) | 最大値 (r={r_max:.4f}) | 期待値 (r={r_exp:.4f}) |")
        print("|--------|-------------------|-------------------|-------------------|")
        for t in range(count + 1):
            print(f"| {t:<8} | {q_min[t]:<17} | {q_max[t]:<17} | {q_exp[t]:<17} |")
        print()


if __name__ == "__main__":
    main()